
Overview
Visually reviewing raw data can have enormous benefits: on one hand, it allows us to find bad data and diagnose equipment malfunction, and on the other, it helps us develop an intuitive sense of our data and its characteristics. Visually reviewing filtered data offers similar opportunities, but you may also wish to do it before extracting features from data, in order to preview the effects of the normalization, filtering, and feature options you’ve chosen. With FeatureFinder, you’ll be able to review your data in an easy and intuitive manner. Several tips to get you started are listed below.
Plot navigation and display
You can bring up a data plot in one of two ways: using the scroll buttons, or using the parameter menus.
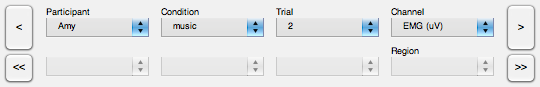
- The arrow buttons < and > load the previous and next files in your file list, respectively. The button << will bring you to the first file in your list; the >> button will load the last. The selected channel of data will not change as you scroll through your data.
- The parameter menus (e.g., “Participant” in the image above) allow you to load a file by its parameters, instead of its filename. This is very handy for jumping to a particular file in a big data set and making visual comparisons between different parameter values (e.g., comparing data collected from Lucy and Lisa under identical experimental conditions).
- The “File” area on the right hand side of the parameter menus shows which file you are currently viewing (e.g., 152nd out of 180 files).
- The file name also appears at the bottom of the screen. Moving the mouse cursor over this area will show you the complete name, in case it is too long to fit in the box.

The “Plot Options” pane near the bottom-right corner of the window allows you to control what information is plotted.
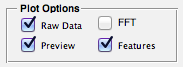
- Raw Data – This option shows the data exactly as it exists in your data files. The x-axis is expressed in time (seconds)—it starts at zero seconds and proceeds according to the provided sampling rate. (Sampling rate can be changed using the Edit button it the “Profile” pane).
- FFT – The FFT option can display a Fast Fourier Transform (FFT) of all visible signals (i.e., raw and/or filtered), showing the signals’ frequency spectra and changing the x-axis to “Frequency (Hz).”
- Preview – Selecting this option will plot the data after it has been filtered and, if selected, normalized. It will also allow you to enable the “Features” plot option.
- Features – Enabling this checkbox will show you the baseline and target windows, in addition to the calculated feature value. Please see the Features and normalization page for more information.
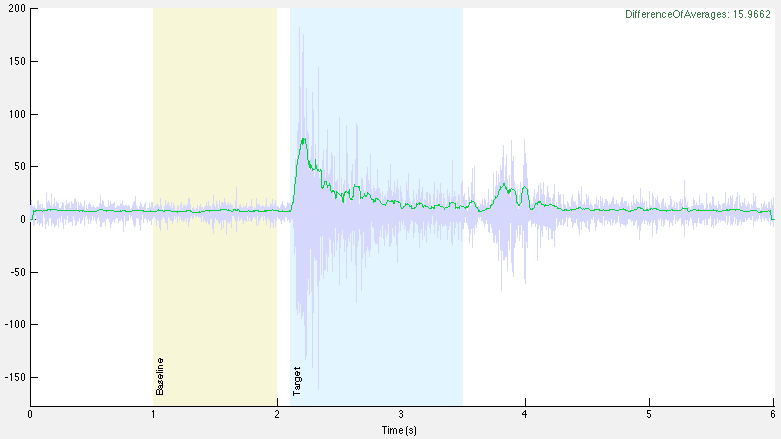
The image below displays a data plot with all three plot options selected. The pale grey-blue signal is the raw data and the green signal is the filtered data. The baseline and target windows are labelled, and the feature value is displayed in the top-right corner.
TIP: You can resize or maximize FeatureFinder‘s main window in order enlarge the data plot!
Plot tools
Several tools are available to help you take a closer look at your data. Instructions on how to use these tools are below.
- Zoom in: Using the mouse or trackpad, double-click on the area on which you wish to zoom.
- Zoom in (specific area): While holding the Shift key, click-and-drag across the area on which to zoom.
- Reset view: Right-click (PC) or CTRL-click (Mac).
- Move the plotted data: Click-and-drag or use the keyboard’s arrow keys.
- Scroll the plotted data: While holding the Shift key, use the arrow keys.
Please note that any clicking or dragging actions must occur inside the plot window.
Exporting data
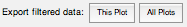
If you wish to export the filtered data, you can do so in one of two ways. You can export only the visible plot by clicking the This Plot button, or you can export filtered versions of the whole file list using the All Plots button. Note that in both cases, only data for the selected channel will be exported.
| << Using the "SMARTfill" tool | Filtering and normalization >> |