
Baseline and target windows
In the “Features” panel, you can setup two data windows that can be used as reference points by many of the features that come with FeatureFinder, and by the features that you’ll create! These areas are referred to as the baseline and target windows or regions.
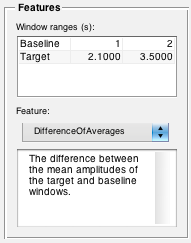
For example, using the values in the image above, the “DifferenceOfAverages” feature would subtract the mean amplitude of the baseline window (between 1.0 and 2.0 seconds) from the mean amplitude of the target window (between 2.1 and 3.5 seconds). The resulting difference would be the calculated feature. This value would be a) displayed on the plot, and b) calculated for every file in your profile when you press the Process button.
Selecting features
In addition to selecting the baseline and target regions, you will also select a feature from the “Feature” drop-down menu (see image above). Note that the selected feature can be different for each channel of your data. Several features come with FeatureFinder, such as the “DifferenceOfAverages” feature in the example above; however, one of FeatureFinder‘s most exciting characteristics is the possibility for users to edit, add, and share features. A guide to feature customization can be found here.
Extracting features
So far, you’ve done quite a bit:
- Setup your profile and added data files;
- Chose filtering and normalization options for each data channel;
- Specified your baseline and target window locations;
- Specified a feature to extract;
- Visually reviewed your data, trying out different plotting options.
Now, it’s time to extract features from all of your data files with the click of a single button:
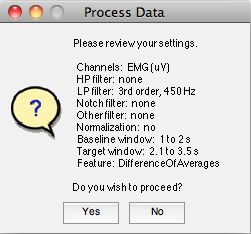
You’ll then be prompted to verify your settings…
If you proceed, you’ll be asked to choose a name for your results file. By default, the results file will be given a unique date-stamped name, and will be placed in FeatureFinder‘s “Results” folder.
Once feature extraction is complete, FeatureFinder will remind you where the results are saved. Here’s what the results file looks like in a spreadsheet program:
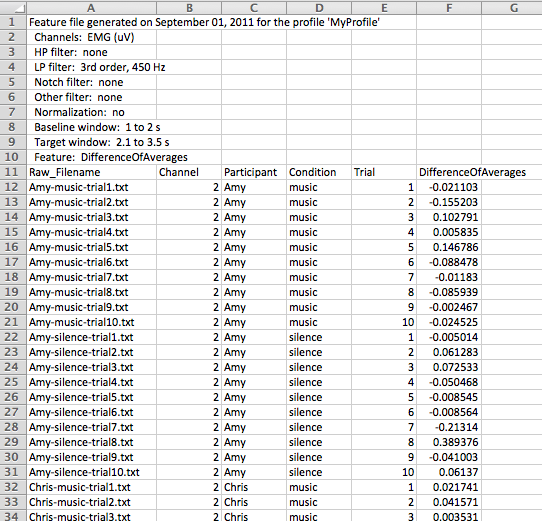
Please note that the complete file paths are normally included in the filename column. They were removed from this image so that the filenames themselves would be visible in the relatively narrow spreadsheet columns.
As you can see, the file header contains all the processing information. The body of the file contains a column for the filename, channel, all parameters, and, of course, the extracted feature.
NOTE: Your raw data will never be edited; all changes are virtual in the FeatureFinder program. So, you don’t have to worry about losing any vital information!
| << Filtering and normalization | Customizing features >> |